This a plot showing the mean abundance of all groups for the final 50 % of the run time from 20 years to 1000 years (in increments of 20 years). (So the abundance at 500 is the mean abundance from years 250-500 for all size classes in that taxa, abundance at 1000 is the mean abundance for 500-1000 etc)
This is a preliminary plot using 553 model runs (The other runs are still downloading).
What do you think @ric325 @ryanheneghan ? On average it would seem (to my eye) we can run for 500 years. The model output will change, but not by a huge amount.
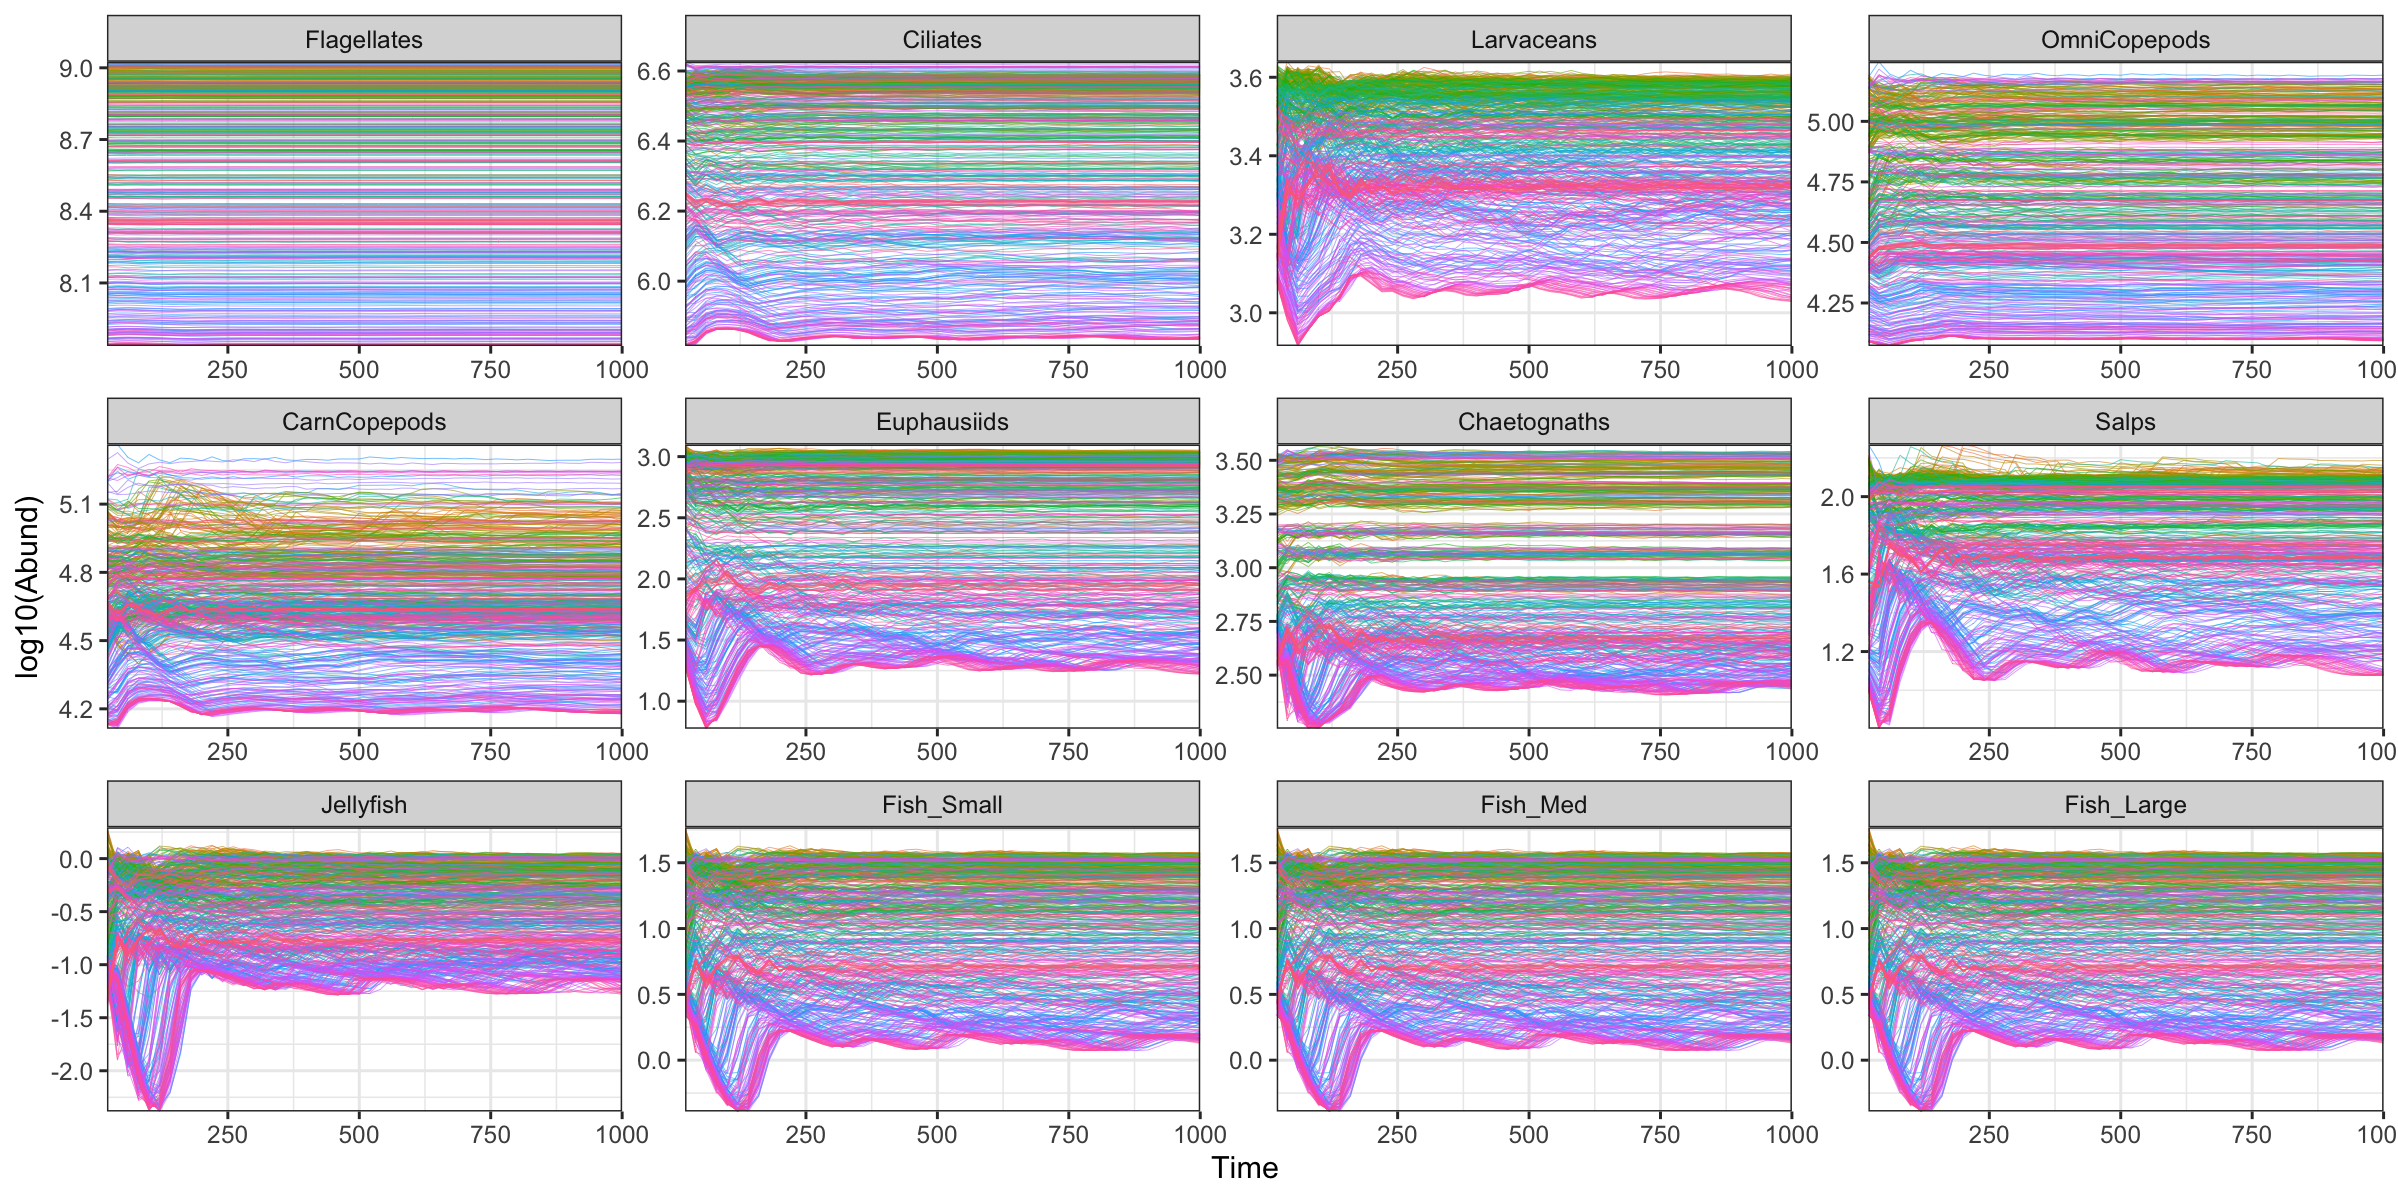
But note this is a run which includes diffusions. I will redo this without diffusion as well....
This a plot showing the mean abundance of all groups for the final 50 % of the run time from 20 years to 1000 years (in increments of 20 years). (So the abundance at 500 is the mean abundance from years 250-500 for all size classes in that taxa, abundance at 1000 is the mean abundance for 500-1000 etc)
This is a preliminary plot using 553 model runs (The other runs are still downloading).
What do you think @ric325 @ryanheneghan ? On average it would seem (to my eye) we can run for 500 years. The model output will change, but not by a huge amount.
But note this is a run which includes diffusions. I will redo this without diffusion as well....